World Happiness Report 2015-2023
Purpose and Context
This project, part of my CareerFoundry Data Analytics Course, aimed to demonstrate practical skills in data sourcing, analysis, and visualization, focusing on the World Happiness Report. Aligned with the course's objective of independent dataset selection, the project utilized Python for exploratory visual analysis, hypothesis development, and advanced analytics. The culmination was a concise Tableau storyboard presentation, showcasing a deep understanding of the data and its implications.
Overview
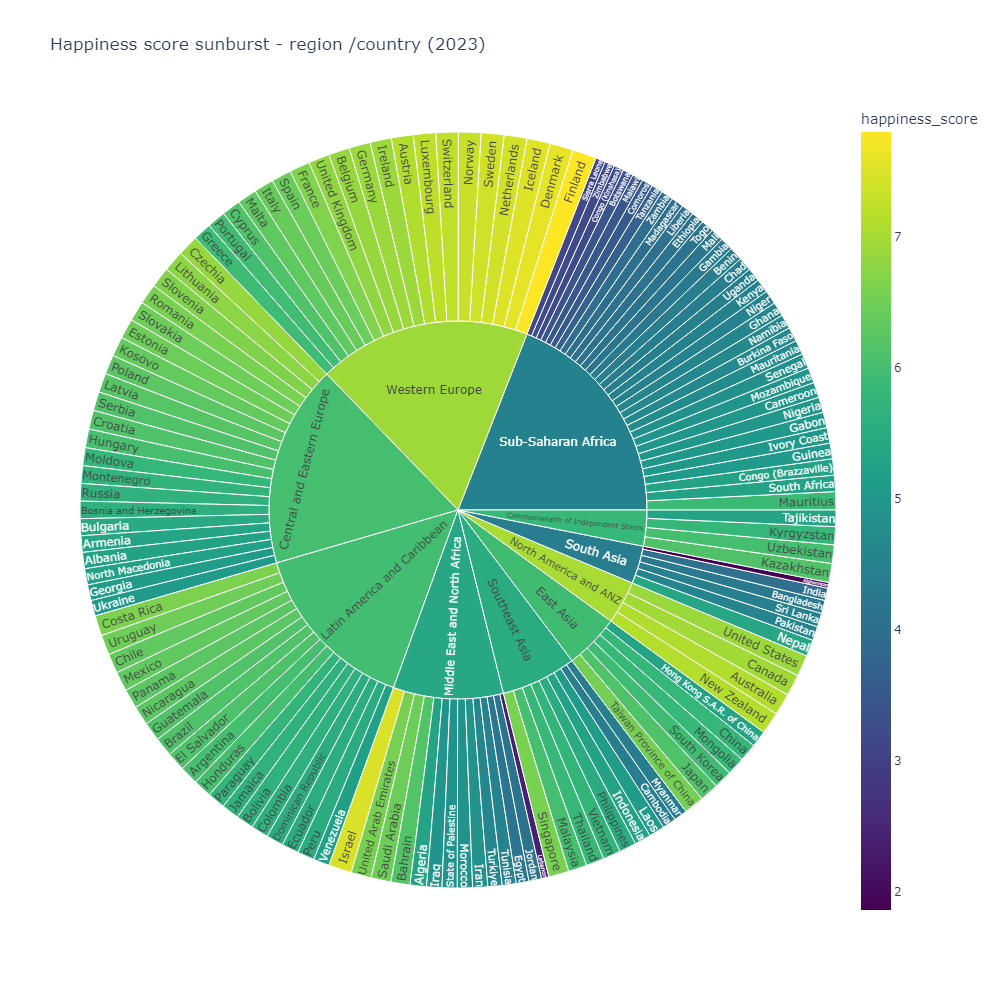
The World Happiness Report, published by the Sustainable Development Solutions Network, ranks countries annually based on life evaluations from Gallup World Poll data. Life evaluations, measured on the Cantril ladder (0 to 10), consider variables like GDP per capita, social support, healthy life expectancy, freedom, generosity, and corruption. This report is a global reference, sparking international conversations on well-being in policy-making
Objective
To proficiently execute exploratory visual analysis in Python, identifying meaningful connections between variables for further exploration. Formulating hypotheses and applying diverse advanced analytical techniques, the conclusive outcomes are communicated through a concise Tableau storyboard presentation.
Key Questions Addressed:
- What is the relationship between GDP per capita, social support, healthy life expectancy, freedom, generosity, and perceptions of corruption on happiness score?
- Which variable has the strongest impact on the happiness score of each country?
- Which Python libraries are most suitable for exploratory data analysis (EDA)?
- How do I choose the right statistical test and interpret the results effectively to make accurate inferences about my data?
- How can I effectively visualize the relationships between variables using Python libraries like Pandas, Matplotlib, and Seaborn?
Tools
Python and libraries (Pandas, NumPy, Matplotlib, SciPy, Seaborn, Folium, Plotly), Tableau, Excel.
Data
Dataset - Kaggle. Primary source - World Happiness Report website.
Steps
1. Cleaning and Merging Data
I began with nine datasets for the World Happiness Report (spanning 2015-2023), each representing a specific year. Utilizing a classic methodology, I merged these datasets, ensuring consistent formatting, addressing missing values, and eliminating duplicates for accurate and reliable data crucial to analysis.
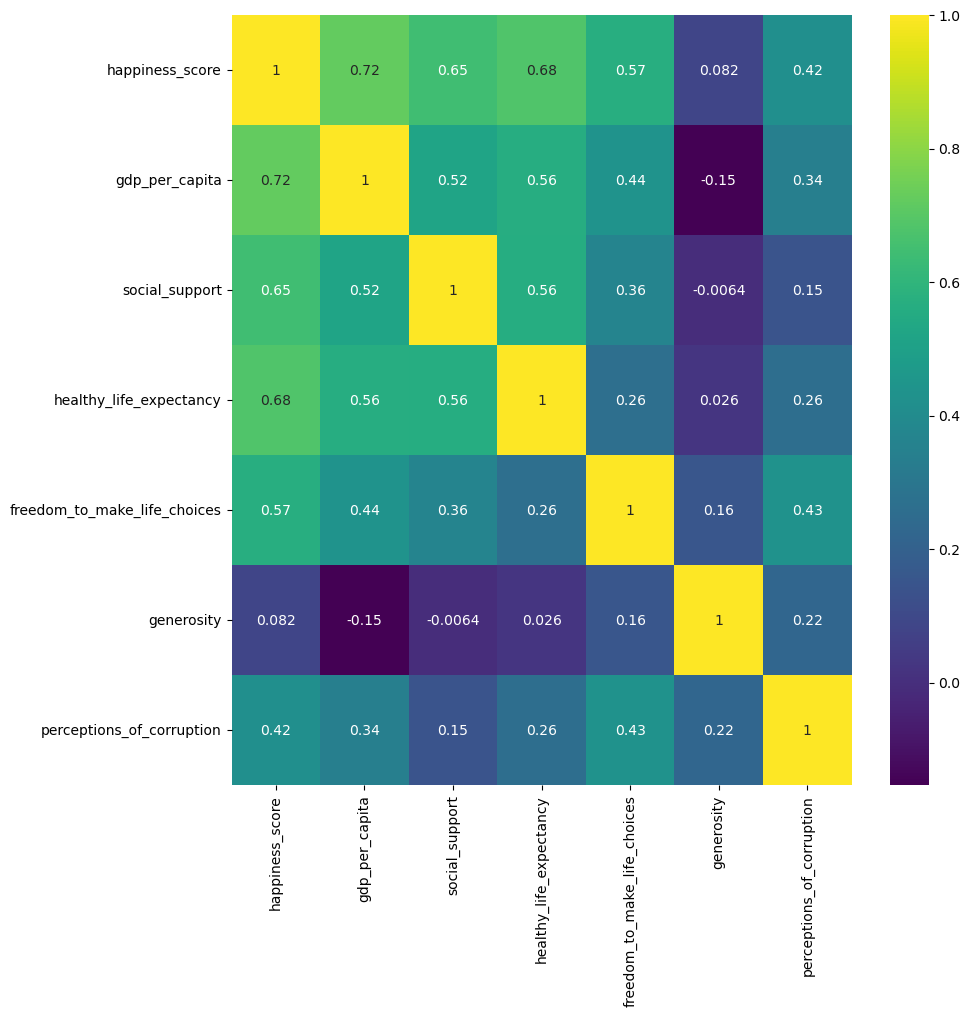
2. Exploring Relationships
Conducting EDA (Exploratory Data Analysis) in Python involved tasks like correlation maps, scatter plots, and pair plots. A notable finding was the highest correlation between happiness score and GDP per Capita, leading to the hypothesis that higher GDP per Capita is associated with higher happiness scores. In order to further investigate this, advanced analytical methods, including regression analysis and k-means clustering, were performed to test and explore these connections.
3. Employing Advanced Analytical Methods
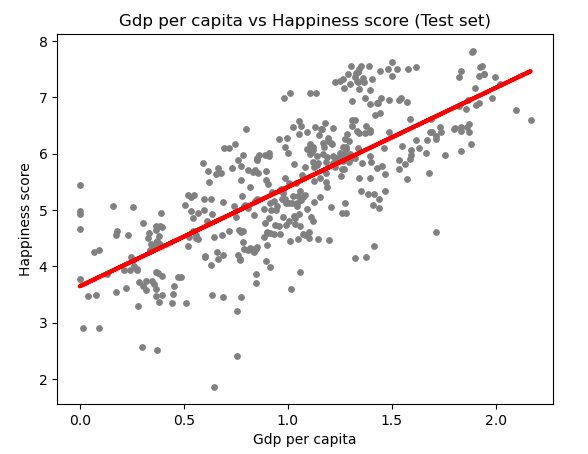
Regression Analysis
Regression analysis helps us understand how one or more factors are related to an outcome, allowing us to predict or explain changes in the outcome based on the values of the factors. The results of the regression analysis were showing that our model moderately explains happiness score variability. Yet, nearly half the variance remains unexplained by GDP Per Capita.
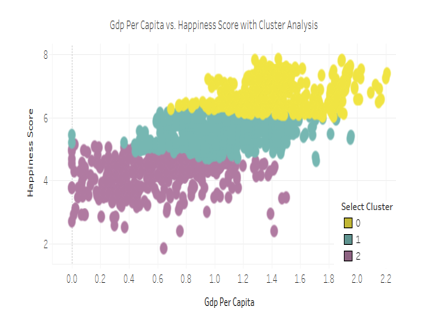
Cluster Analysis
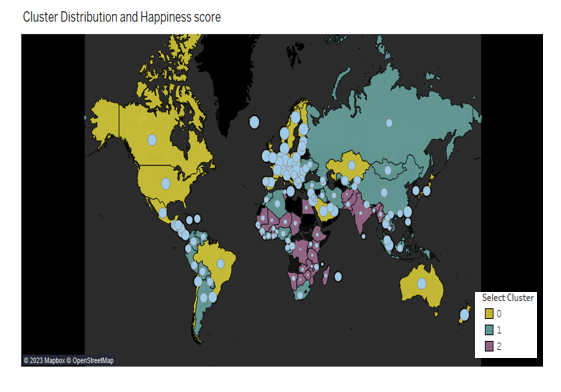
A cluster analysis groups data points into "clusters". We can then compare the groups of data to uncover new patterns. Utilizing clustering, three distinct groups emerged. Analyzing the chart below, it's evident that countries in the Cluster 0 not only boast the highest median Happiness scores but also lead in GDP Per Capita.
4. Spatial Exploration
Integrating a shapefile for spatial representation, I delved into geographic insights regarding the relationship between GDP per Capita and happiness scores. The results supported the hypothesis, confirming that regions with higher GDP were associated with elevated happiness scores.
More details about the project:
Challenges
-
Understanding the Kaggle Dataset
Understanding the Kaggle dataset posed initial challenges, particularly in interpreting terms like Corruption Perceptions. A notable anomaly emerged as countries with the highest happiness scores and elevated values in other variables exhibited unexpectedly high corruption values. To resolve this inconsistency, I conducted a thorough verification process using the World Happiness Report's official page—the dataset's primary source. The investigation clarified that variables represented contributions to the Happiness Score, not absolute measures. In the case of Corruption Perceptions, higher values indicated a lack of corruption, contributing positively to happiness in countries with higher happiness scores
-
Project Time Constraints
The project encountered challenges in navigating the vast possibilities within the data. Despite the desire to delve deeper into regional aspects and variations, time constraints mandated a focused approach.
Final Words
In the World Happiness Report project, my journey through the realms of data analytics was both enlightening and with surprises.
What surprised me was the nuanced relationship between happiness and GDP per capita. Initially, I expected a linear correlation, assuming that higher GDP per capita would consistently translate to higher happiness scores. However, the data challenged this assumption, revealing that the happiest countries don't consistently possess the highest GDP per capita. This unexpected finding underscores the complexity of factors influencing happiness.
The unexpected revelation was the profound versatility of Python, not only as a tool for visualization but as a robust platform for advanced analytics, embracing methods like regression analysis and k-means clustering. The experience enriched my understanding of data analytics, teaching me to navigate challenges, validate hypotheses, and communicate findings effectively through Tableau.
Summary
Moving forward, a multivariate exploration, employing techniques such as multiple regression, will provide a nuanced understanding of how combinations of these factors interact to influence happiness, ensuring a comprehensive analysis beyond GDP per Capita alone.
Exploring residual factors, with a focus on cultural, environmental, and political variables, to uncover additional influences on happiness beyond the primary variables considered in the World Happiness Report.